World Health Statistics 2021
A visual summary
In 2015, Member States agreed to the United Nations Sustainable Development Goals (SDGs) as a global call-to-action to guarantee that all people enjoy health, peace and prosperity by 2030.
The World Health Statistics report is the World Health Organization’s (WHO) annual compilation of the most recent data on health and health-related indicators for its 194 Member States. The 2021 edition reflects the status of the world just prior to the COVID-19 pandemic, which has threatened to reverse much of the progress made in recent years. It presents health trends from 2000-2019 across countries, regions and income groups with the latest data for more than 50 health-related indicators for the SDGs and WHO’s Thirteenth General Programme of Work (GPW 13).
While COVID-19 has been a crisis of historic proportions, it also presents opportunities to rapidly scale up global collaboration and fill long-standing data gaps. The 2021 report presents data on the human toll of the COVID-19 pandemic, highlighting the importance of monitoring inequalities and the urgency to produce, collect, analyse, and report timely, reliable, actionable and disaggregated data to get back on track towards our global goals.

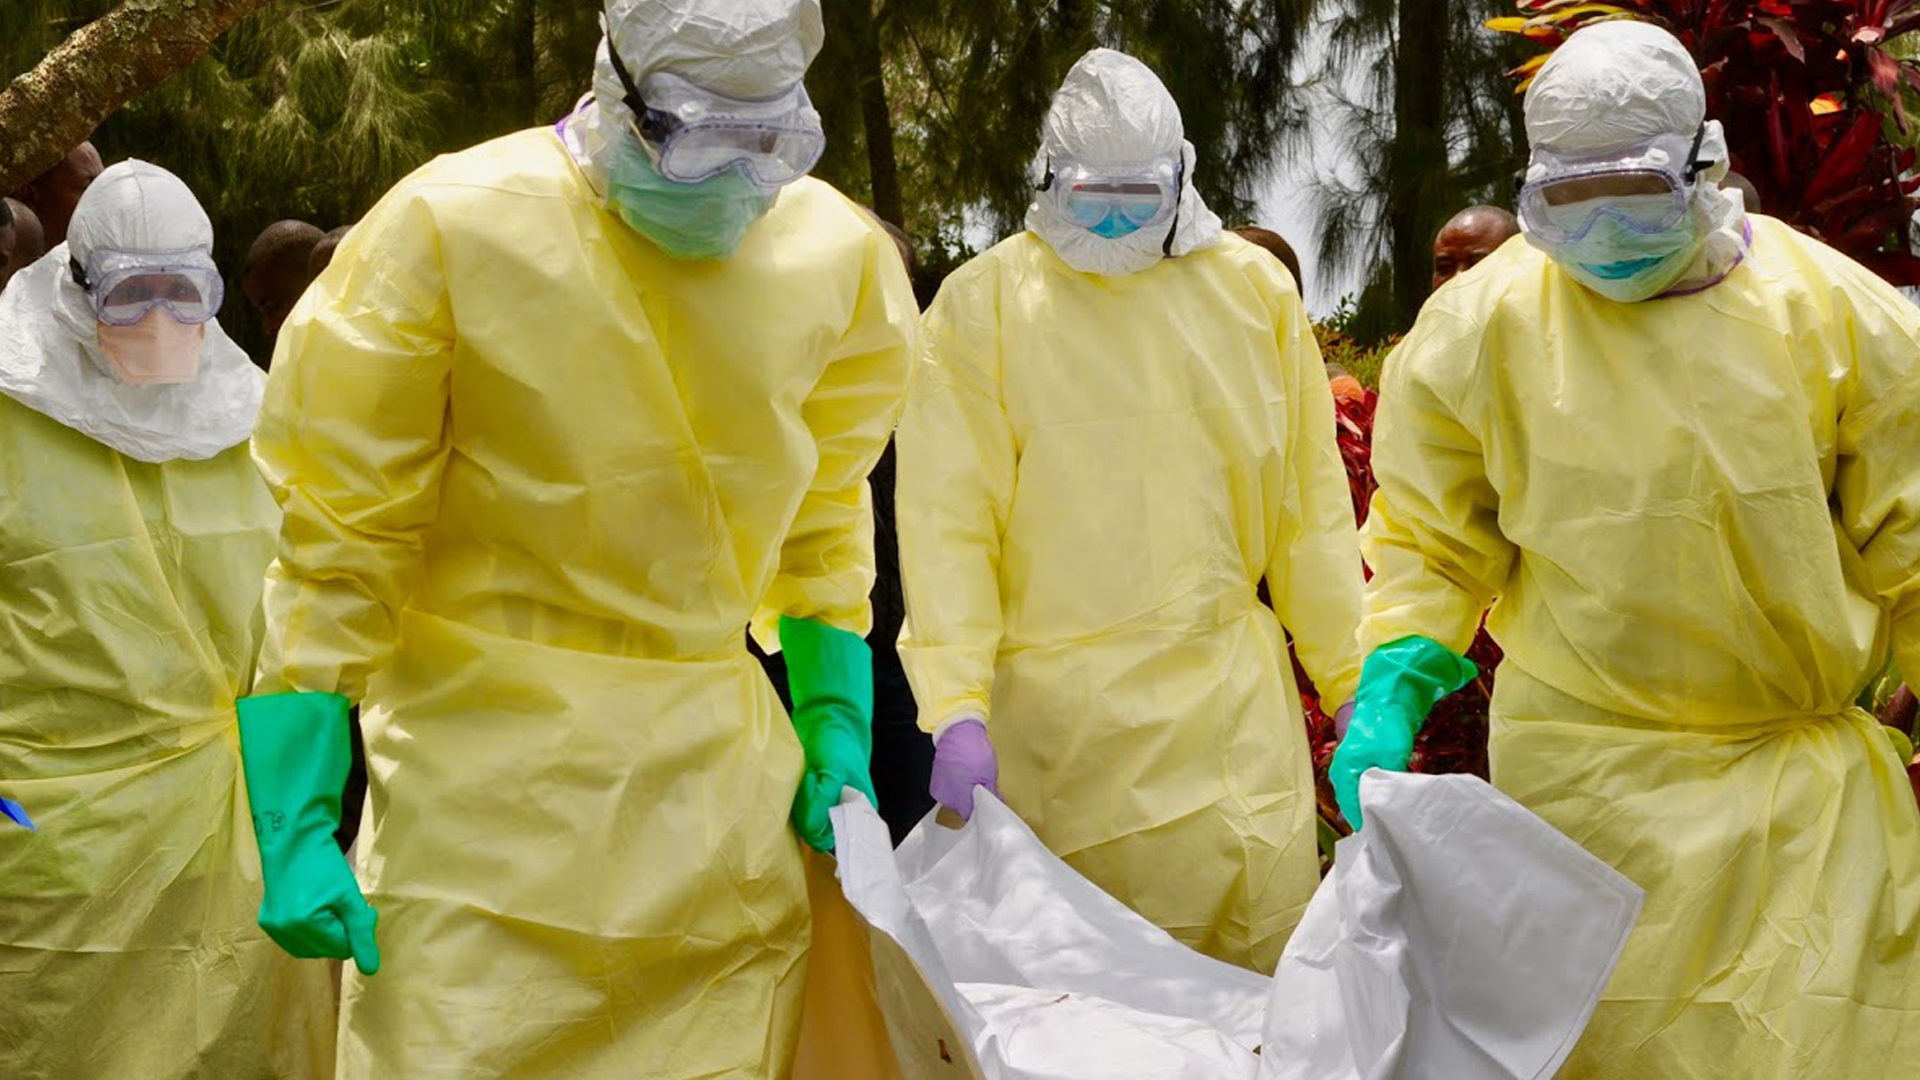
An emergency response team conducts exercises in the Democratic Republic of the Congo.
Impact of COVID-19 on population health
COVID-19 poses major challenges to population health and well-being globally and hinders progress in meeting the SDGs and WHO’s Triple Billion targets.
The WHO Triple Billion targets are a shared vision among WHO and Member States, which help countries to accelerate the delivery of the SDGs. By 2023 they aim to achieve: one billion more people enjoying better health and well-being, one billion more people benefiting from universal health coverage (covered by health services without experiencing financial hardship) and one billion more people better protected from health emergencies.
As of 1 May 2021, over 153 million confirmed COVID-19 cases and 3.2 million related deaths have been reported to WHO. The Region of the Americas and the European Region have been the most affected, together comprising over three quarters of cases reported globally, with respective case rates per 100 000 population of 6114 and 5562 and almost half (48%) of all reported COVID-19-associated deaths occurring in the Region of the Americas, and one third (34%) in the European Region.
Of the 23.1 million cases reported in the South-East Asia Region to date, over 86% are attributed to India. Despite the extensive spread of the virus, COVID-19 cases to date appear to be concentrated predominantly in high-income countries (HICs). The 20 most impacted HICs account for almost half (45%) of the world’s cumulative COVID-19 cases, yet they represent only one eighth (12.4%) of the global population.
COVID-19 has surfaced long-standing inequalities across income groups, disrupted access to essential medicines and health services, stretched the capacity of the global health workforce and revealed significant gaps in country health information systems.
While high-resource settings have faced challenges related to overload in the capacity of health services, the pandemic poses critical challenges to weak health systems in low-resource settings and is jeopardising hard-won health and development gains made in recent decades.
Data from 35 high-income countries shows that preventive behaviours decrease as household overcrowding (a measure of socioeconomic status) increases.
Overall, 79% (median value of 35 countries) of people living in uncrowded households reported trying to physically distance themselves from others compared to 65% in extremely overcrowded households. Regular daily handwashing practices (washing hands with soap and water or using hand sanitizers) were also more common among people who lived in uncrowded households (93%) compared to those living in extremely overcrowded households (82%). In terms of mask-wearing in public, 87% of people living in uncrowded households wore a mask all or most of the time when in public in the last seven days compared to 74% of people living in extremely overcrowded conditions.
The combination of conditions related to poverty reduce access to health services and evidence-based information while increasing risky behaviours.
DATA VISUALIZATION
This data visualization shows WHO member states separated by the six WHO regions. They are positioned on the x-axis by the ‘percentage of healthy years in life expectancy’ and bubbles scaled by the member states ‘healthy years of life (HALE)’. You can toggle between data for the years 2000 and 2019. Ranges for ‘percentage of healthy years in life expectancy’ go from 84.7% to 90.3% in 2000 and 84.2% to 89.5% in 2019. The range for HALE goes from 38 years to 72 years in 2000 and 44 years to 74 years in 2019.
Note: Extremely overcrowded defined as more than five people per room used for sleeping in the house. Moderately overcrowded defined as more than two but less or equal to five. Uncrowded defined as two or fewer. Physical distancing is defined as intentionally
avoiding contact with other people all the time or most of the time. Handwashing is defined as washing their hands with soap and water or used hand sanitizer 3+ times in the last 24 hours. Mask wearing refers to wearing a mask all the time or most
of the time when in public in the last 7 days. Based on COVID-19 World Symptoms Survey led by Facebook and the University of Maryland in 35 high-income countries. This analysis includes data between May 2020 and February 2021.
Source: WHO calculations using COVID-19 World Symptoms Survey data.
Currently, WHO, in collaboration with GAVI, the Vaccine Alliance and the Coalition for Epidemic Preparedness Innovations, is co-leading the COVAX initiative to accelerate the development, production, and equitable access to COVID-19 tests, treatments, and vaccines. Unequal roll-out of vaccines amidst the spread of new variants puts lower-resourced settings at greater risk and partly explains the recent shift of mortality distribution from higher to lower-resource settings.

Women working on a nutritional education program to help prevent noncommunicable diseases in Tulagi, Solomon Islands.
Health inequalities
Irrespective of the pandemic, existing inequalities, both within countries and between countries, impede appropriately targeted interventions. Despite recent global health gains, people everywhere continue to face a complex blend of interconnected threats to their health and well-being. Many of these threats are rooted in social, political, economic and gender inequalities and other determinants of health.
Indeed, COVID-19 has shone a harsh spotlight on these inequalities and the importance of using timely, high-quality data to address them. One of the key benefits of disaggregated data – particularly data broken down by income, sex and age – is that it can reveal these deeper, unseen inequalities.
Life expectancy and healthy life expectancy
The global population continues to live longer and live more years in good health. Between 2000 and 2019, global life expectancy (LE) at birth increased from 66.8 years in 2000 to 73.3 years in 2019, and healthy life expectancy (HALE) increased from 58.3 years to 63.7 years. Despite sharing similar increasing trends, LE and HALE among females were consistently higher than males.
DATA VISUALIZATION
This data visualization shows WHO member states separated by the six WHO regions. They are positioned on the x-axis by the ‘percentage of healthy years in life expectancy’ and bubbles scaled by the member states ‘healthy years of life (HALE)’. You can toggle between data for the years 2000 and 2019. Ranges for ‘percentage of healthy years in life expectancy’ go from 84.7% to 90.3% in 2000 and 84.2% to 89.5% in 2019. The range for HALE goes from 38 years to 72 years in 2000 and 44 years to 74 years in 2019.
Source: Global Health Estimates, 2019. Life expectancy and leading causes of death and disability by sex by country and by region 2000-2019. Geneva, World Health Organization; 2020.
LE and HALE also rise with national income levels, however the fastest improvements were observed in low-income countries (LICs), gaining over 11 years in LE and nearly 10 years in HALE in 2000-2019, predominantly reflecting the remarkable progress made in reducing mortality among children under 5 years of age in the past 20 years.

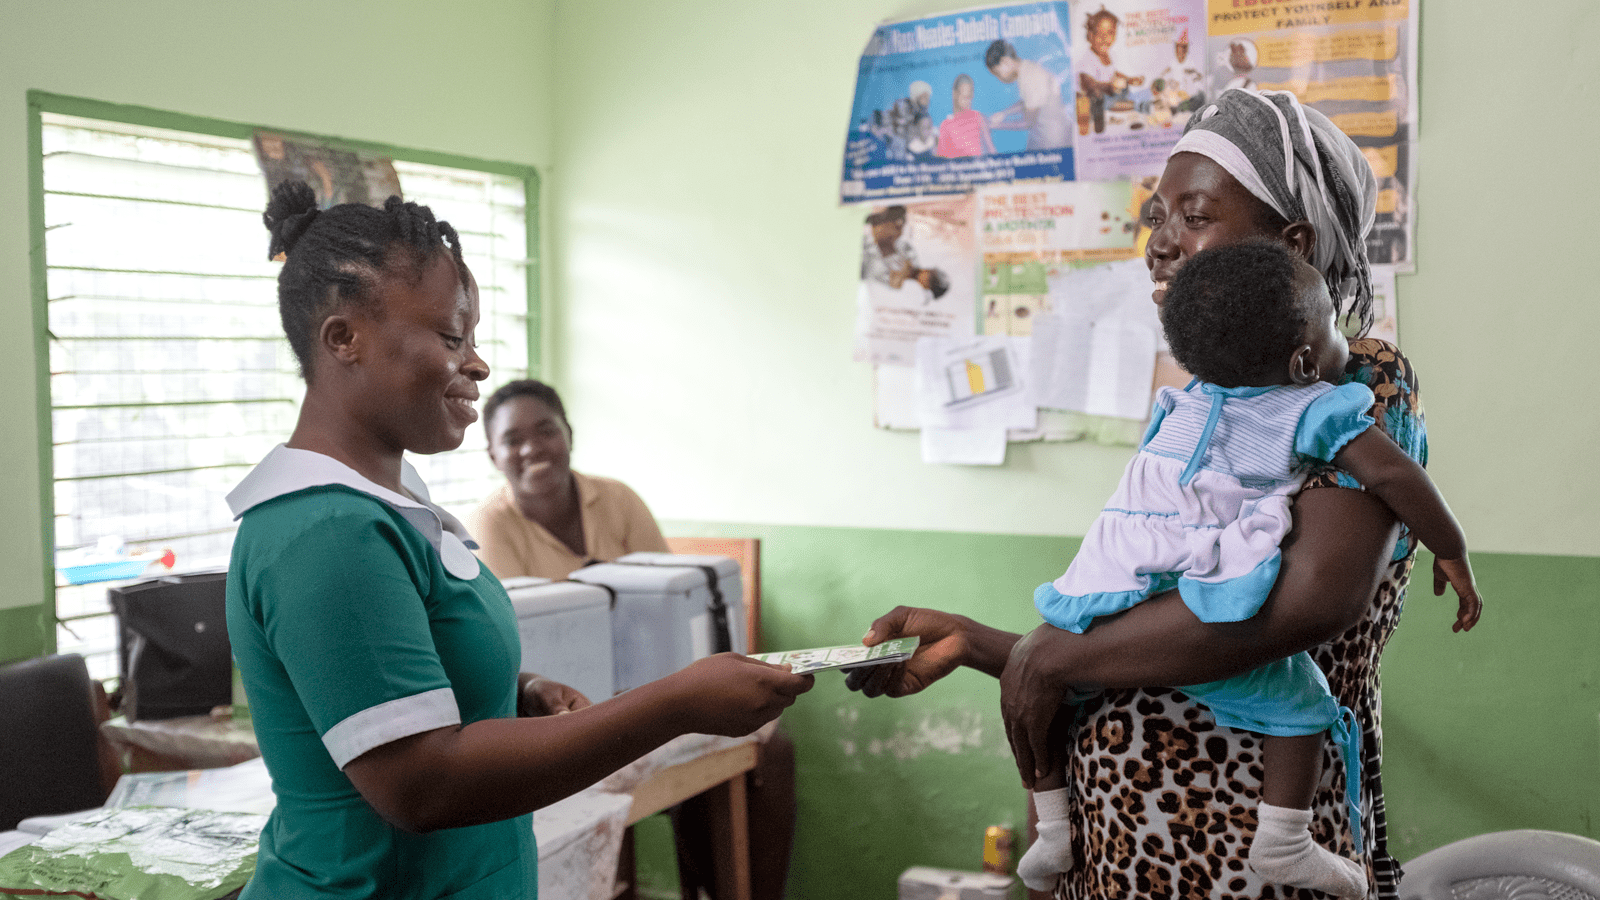
A mother receives a record book for her 6-month-old daughter after being vaccinated as part of the Malaria Vaccine Implementation Programme in Ghana.
Burden of disease
Thanks to sustained global efforts, significant progress continues to take place, particularly in reducing the number of deaths caused by communicable, maternal, perinatal and nutritional conditions (communicable diseases hereafter). Progress in preventing and treating these diseases (especially those that tend to kill children under 5 years of age) has seen them decline significantly relative to noncommunicable diseases and injuries. Consequently, the global share of NCD deaths among all deaths increased from 60.8% in 2000 to 73.6% in 2019.
DATA VISUALIZATION
This chart shows the trends in the top 10 leading causes of death by country income groups, from 2000 to 2019. It shows which causes of death have entered and left the top 10 in each income group. Each bar is coloured based on if the cause of death is noncommunicable, communicable or an injury. By hovering on each of the causes it reveals the number of deaths and the rank in 2000, 2010 and 2019. By switching between income groups using the toggle, it highlights that in low income countries, you are more likely to die of a communicable disease compared to any other income group – six of the top 10 causes of death in 2019 are communicable. Whereas in high income countries there is only one communicable disease featuring in the top 10.
Source: Global Health Estimates, 2019. Life expectancy and leading causes of death and disability by sex by country and by region 2000-2019. Geneva, World Health Organization; 2020.
It is not just deaths that are falling from communicable diseases – Disability Adjusted Life Years (DALYs) and Years Lived with Disability (YLD) are all decreasing. Again, not just the extension of life, but the extension of healthy life. This is a global success worth celebrating and sustaining.
A huge factor in this story is the great advances in reducing some of the world’s leading infectious diseases. HIV/AIDS and tuberculosis have both dropped out of the top 10 global causes of death in 2019. At the global level, this means seven of the top 10 causes of death in 2019 were non-communicable diseases. This is an increase from four of the top 10 causes in 2000.
Tuberculosis (TB) remains the world’s leading cause of death from a single infectious agent. Globally, an estimated 10 million (range, 8.9–11 million) people fell ill with TB in 2019, a number that has been declining very slowly in recent years but not fast enough to reach the 2020 milestone of a 20% reduction between 2015 and 2020.
New HIV infections have been reduced by 40% since the peak in 1998. In 2019, around 1.7 million people were newly infected with HIV, more than a million fewer than in 1998. However, this is far from the 2020 global milestone of below 500 000 new infections.
The malaria mortality rate has been more than halved: from 25 deaths per 100 000 population at risk in 2000 to just 10 per 100 000 population at risk in 2019. The total number of malaria deaths worldwide fell from 736 000 in 2000 to 409 000 in 2019.
DATA VISUALIZATION
This chart shows the rates of malaria incidence, tuberculosis (TB) incidence and new HIV infections. The chart has data for 2000 and 2019, and also highlights the 2019 global average. There has been overall improvement from 2000 to 2019, except for an increase in new HIV infections in Europe and Eastern Mediterranean. More general trends show malaria incidence in Africa is 22 times greater than the next closest region in 2019 (225 per 1000 people in Africa vs 10 per 1000 people in Eastern Mediterranean). There is a very similar story for new HIV infections, with Africa 4.5 times higher than the next closest region in 2019 (0.94 per 1000 in Africa vs. 0.21 per 1000 in Europe). The distribution for TB incidence is far more evenly spread in 2019, with Africa having 226 incidences per 100 000 people, South-East Asia with 217 per 100 000 and Eastern Mediterranean with 114 per 100 000.
Source: World malaria report, 2020. Geneva, World Health Organization; 2020. Global tuberculosis report, 2020. Geneva, World Health Organization; 2020. HIV/AIDS (Global Health Observatory) [online database]. Geneva, World Health Organization; 2019.
This is remarkable progress. But nonetheless, the 18% reduction in malaria mortality rate in 2019 compared to 2015 is far from the milestone of a 40% reduction by 2020. And progress is off track to meet the target of at least 90% reduction by 2030.
These diseases still pose a major threat. The African Region continues to lag far behind the global average in all three, despite dramatic progress in the past two decades. Progress in the fight against malaria has stalled in most regions since 2014. And HIV mortality rates have increased in the Europe and Eastern Mediterranean Regions compared with 2000.
Trends in deaths due to the four major NCDs (cancer, cardiovascular diseases (CVD), diabetes and chronic respiratory diseases (CRD)) in all ages were driven by diverse changes across regions in 2000–2019. Globally, the greatest decline in mortality was seen for CRD, with a 37% decline in age-standardized rates (ASR) for all ages, followed by CVD and cancer at 27% and 16% respectively. However, the ASR for diabetes has shown an unfavorable trend with a 3% increase.
Global premature NCD mortality – as measured by the probability of dying from one of the four major NCDs between the ages 30 and 70 years (SDG indicator 3.4.1) – dropped over one fifth from 22.9% in 2000 to 17.8% in 2019. The progress has been slow since 2015. Without effective acceleration strategies, the world is destined to fall short of the SDG target with only few countries on track to meet it.
There has also been a steady decrease in mortality from suicide, homicide, unintentional poisoning, and road traffic deaths since 2000 but these affect males and females differently. Globally, 63% of deaths from unintentional poisoning and 69% of deaths from suicides occurred among boys and men. This inequality is even greater for road traffic deaths and homicide: 75% and 80% of the deaths worldwide in 2019 were boys and men. Overall, men are at higher risk of dying due to injuries. In 2019, men comprised 66% of deaths from unintentional injuries (vs 34% women) and 73% of deaths from intentional injuries (vs 27% women).
DATA VISUALIZATION
This visualization shows the trends from 2000 to 2019 for the mortality rate per 100 000 people for four indicators: suicide, homicide, unintentional poisoning and road traffic. The data is separated by both gender and country income groups. Overall, there has been a steady decrease in mortality from suicide, homicide, unintentional poisoning, and road traffic deaths since 2000 but these affect male and female differently.
Source: Global Health Estimates, 2019. Life expectancy and leading causes of death and disability by sex by country and by region 2000-2019. Geneva, World Health Organization; 2020.

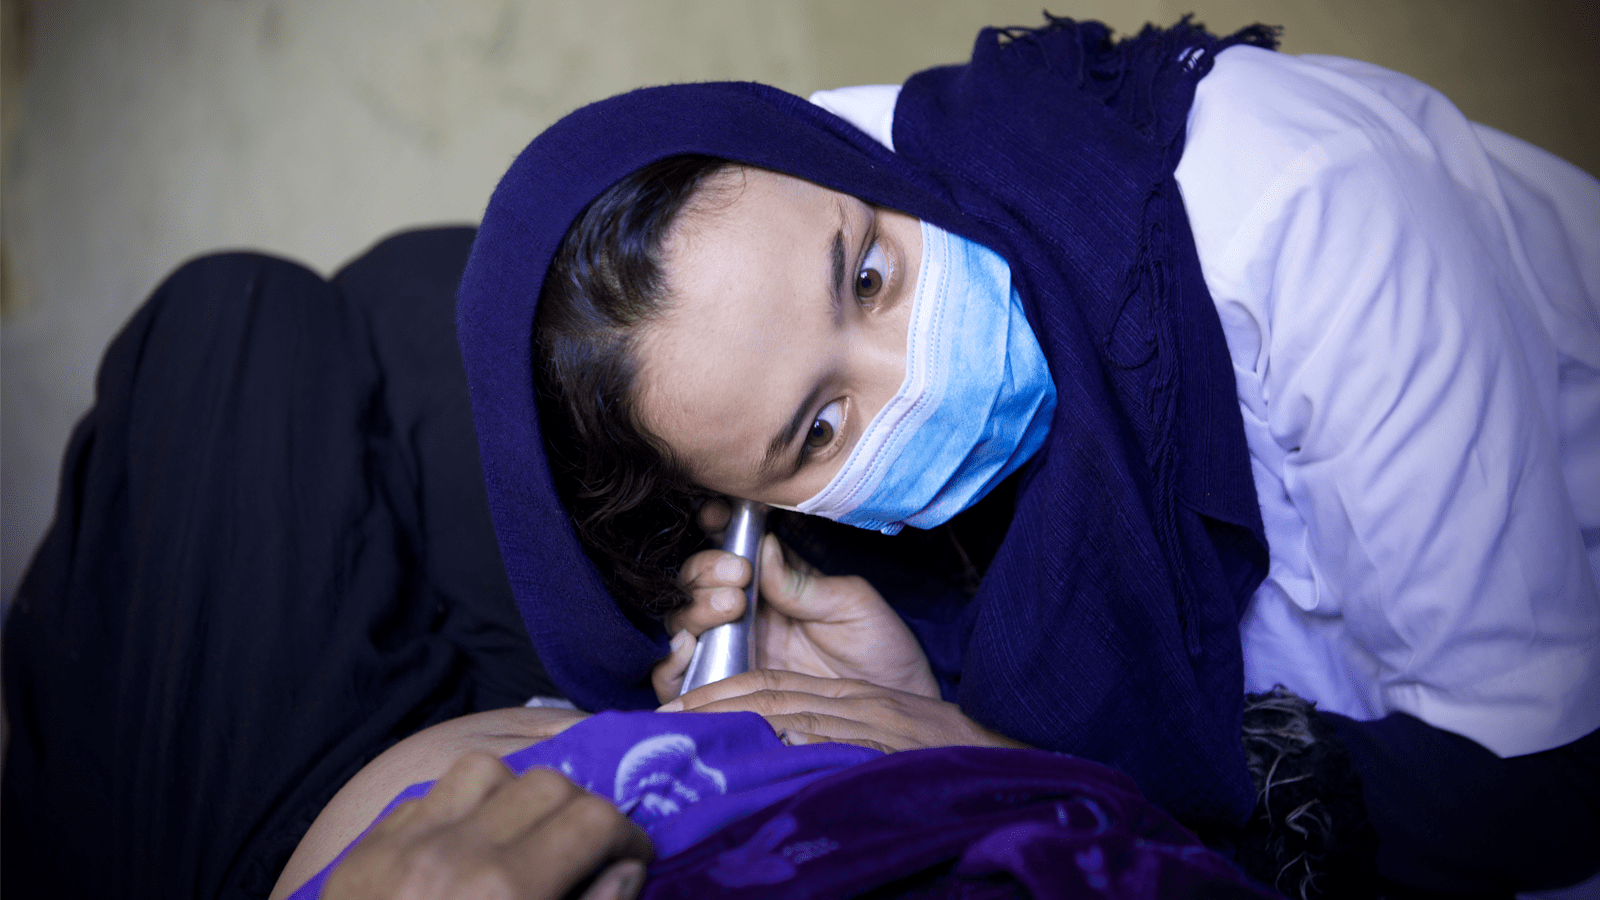
A midwife listens to a baby's heartbeat in a WHO-supported mobile clinic in Bamyan province, Afghanistan.
Universal health coverage and the health workforce
Achieving Universal health Coverage (UHC) is one of the targets the nations of the world set when adopting the SDGs in 2015 and when reaffirming this commitment at the United Nations General Assembly High Level Meeting on UHC in 2019. It means that all individuals and communities receive the health services they need without suffering financial hardship.
Although improvements in coverage of essential health services have been recorded in all income groups and across different types of services – with the UHC service coverage index (SCI) increasing from a global average of 45 (of 100) in 2000 to 66 in 2017 – many inequalities persist. Globally and for many countries, the pace of progress has slowed since 2010, and the poorest countries and those affected by conflict generally lag furthest behind.
Overall, financial protection prior to COVID-19 has been deteriorating. The proportion of the population with out-of-pocket spending exceeding 10% of their household budget rose from 9% to 13% and those exceeding 25% rose from 1.7% to 2.9%, over the period 2000-2015. Continued progress requires considerable strengthening of health systems, particularly in lower income settings, along with a recognition of the crucial role of healthcare workers in public health capacity with adequate protection for their safety and wellbeing.
The global health workforce has responded heroically since the pandemic began. And fittingly, 2021 has been designated International Year of Health and Care Workers in appreciation of their unwavering dedication in the fight against COVID-19. Yet the world needs millions more of them if it is to achieve universal health coverage by 2030.
DATA VISUALIZATION
This chart uses dots to show the number of people for every single nurse/midwife and physician. It reveals the disparities observed between regions. For instance, for every physician in Africa there are 3623 people compared to just 232 people in Europe. The same for nurse/midwife: where Africa has one for every 973 people, there is one for every 121 people in the Americas.
Source: National Health Workforce Accounts Data Portal [online database]. Geneva, World Health Organization.
There are dramatic disparities in the number of people for each health worker across different WHO regions. This reveals just how varied the distribution is throughout the world and highlights the unacceptable scarcity of health workers in some regions.
Regionally, health workers who deliver essential services are at their lowest density in the places where the highest burden of disease was measured. Even when national densities are sizable, inequalities persist between rural, remote and hard-to-reach areas compared to capital cities and urban centres. According to the latest available data from 2014-2019, density of health workers is the lowest in the WHO African Region, with just three doctors per 10 000 population and 10 nursing/midwifery personnel per 10 000 population.
According to the data available for 2014–2020, 83% of global births were assisted by skilled birth attendants, including medical doctors, nurses and midwives. This is an increase of about 30% compared to data from 2000–2006. These frontline health professionals are the people who respond to both emergencies and everyday needs. Investments in better infrastructure for health facilities, continuous education and capacity-building and better working conditions for health and care workers – all relevant to universal health coverage – will be crucial.

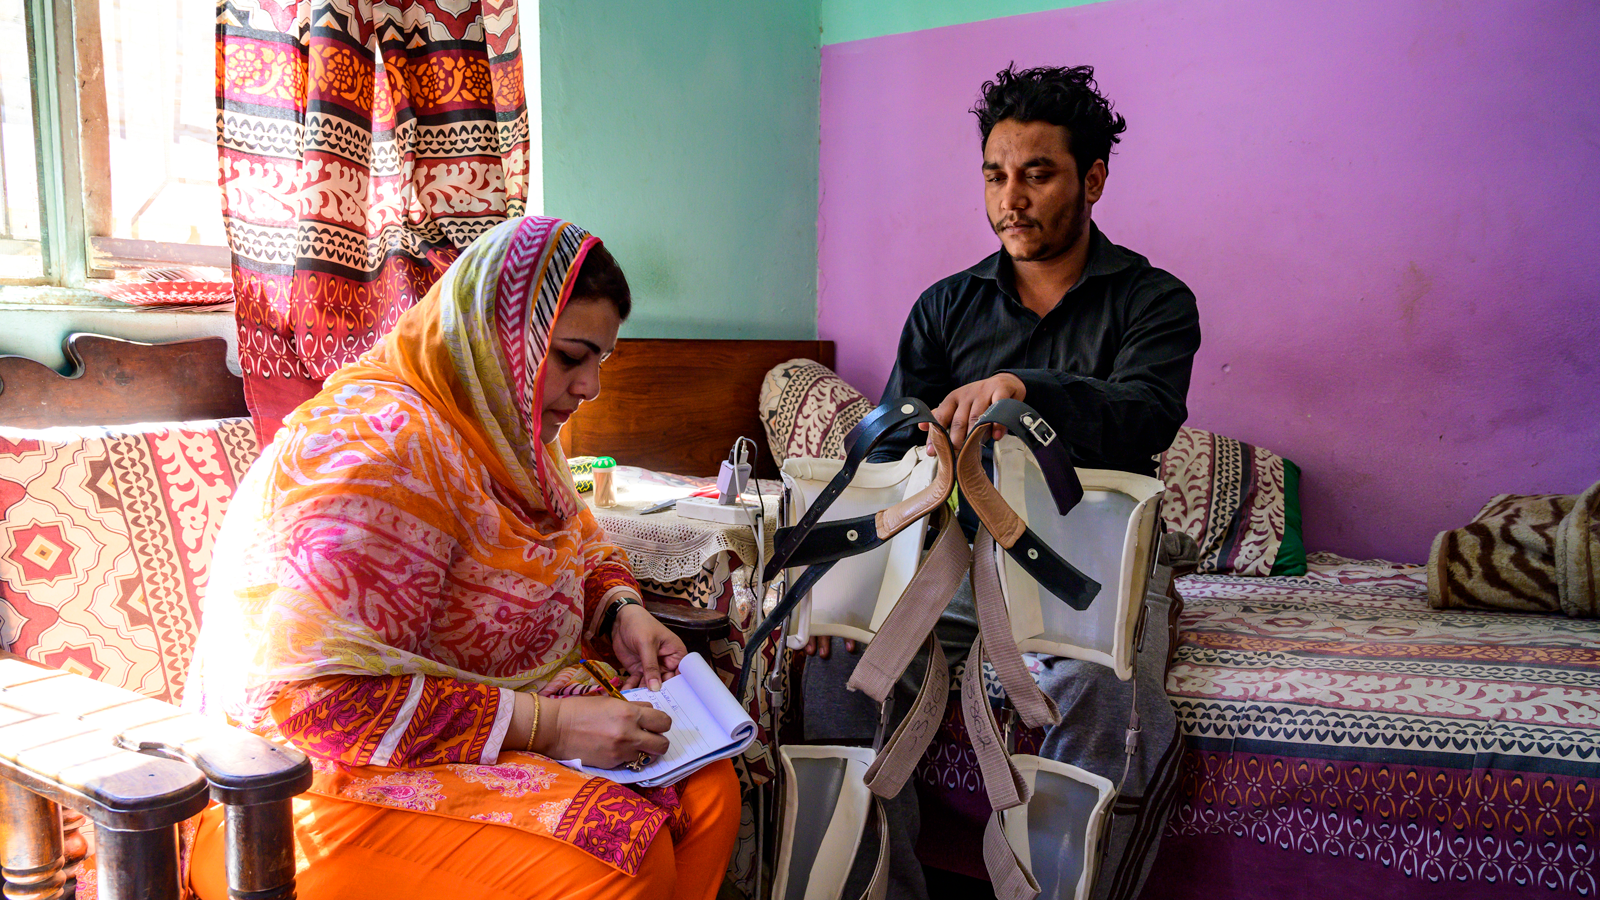
A health worker visits a man with a spinal cord injury to conduct a field assistive technology survey in Islamabad, Pakistan.
Challenges in reporting data disaggregation
Despite recent progress, the lack of disaggregated data remains a significant challenge across the world. Current data is inadequate in many countries to monitor health inequalities and assess the situation of vulnerable populations. According to the recent WHO SCORE global report, 2020, only half of countries included disaggregated data in their published national health statistics reports. These data blind spots can mask the struggles of vulnerable groups and people living in specific areas misleading policymakers’ efforts to allocate resources effectively and prioritize interventions properly.
DATA VISUALIZATION
This bar chart shows the percentage of national statistical reports that have disaggregated health data. There are five bars: one for the global value and one for each of the income groups. Globally only half of the world’s reports include disaggregated health data. The lowest is in lower-middle income countries with 47% compared to 63% in high income countries.
Source: SCORE global report on health data and systems capacity, 2020. Geneva, World Health Organization; 2020.
Urgent investments and synthesized efforts are needed to strengthen health information systems in countries. Specifically, the ability to generate high-quality, timely, reliable and disaggregated data is crucial for identifying the health inequalities to inform targeted, effective decision-making.
While WHO collects COVID-19 cases and deaths data from Member States, between January 2020 and April 2021, only 41 out of 236 countries, areas or territories (17%) reported sex-disaggregated data for at least 95% of cases. And 72 countries (30%) reported sex-disaggregation for at least 70% of cases. Globally, sex disaggregated data was reported for just over half of all cases (51%). This percentage has increased in the past two months, reflecting the improvement of surveillance and reporting.
The lack of disaggregated COVID-19 data – by income, education, sex, age, race, ethnicity, migratory status, disability, geographic location and other characteristics – limits the development of more effective and better-targeted policies and the data-driven allocation of resources. And while countries reported more disaggregated data at the beginning of the pandemic, this has decreased over time.
WHO’s SCORE for Health Data Technical Package offers a one-stop solution for countries to generate, analyse and use data to inform policy and actions. It can serve as a guide for countries to invest in the areas that are most impactful and also as a monitoring tool to track progress towards the SDGs and WHO's Triple Billion targets.
Conclusion
Between 2000 and 2019, major gains in health have occurred at global level, resulting in the increase in life expectancy and healthy life expectancy at birth, with the fastest improvements in low income countries, reflecting predominantly the remarkable progress made in reducing child mortality and major communicable diseases. There has also been a steady decrease in mortality from suicide, homicide, unintentional poisoning and road traffic with men at higher risk of dying due to injuries globally.
Since 2020, the COVID-19 pandemic threatens to derail the progress made towards the SDGs over the last 20 years while underscoring existing inequalities in health within and between countries.
Tracking any changes in health-related indicators is critical, on all fronts, to identify where investments would be more impactful for improving population health and tackling the root causes of inequities, putting inclusiveness and equity at the heart of all recovery responses to create a fairer, healthier world.
From unmasking obscured health inequality to informing policies and prioritizing interventions, disaggregated data can drive communities to achieve health equity. With more timely and reliable data, progress can be monitored more effectively towards all health goals and priorities at national, regional and global levels.
With the clock ticking, countries need to double down on the investment in their health information systems to better prepare for future outbreaks and ensure rapid progress towards achieving the Triple Billion targets by 2023 and the health-related SDGs by 2030.
